Restoration data,
finally legible.
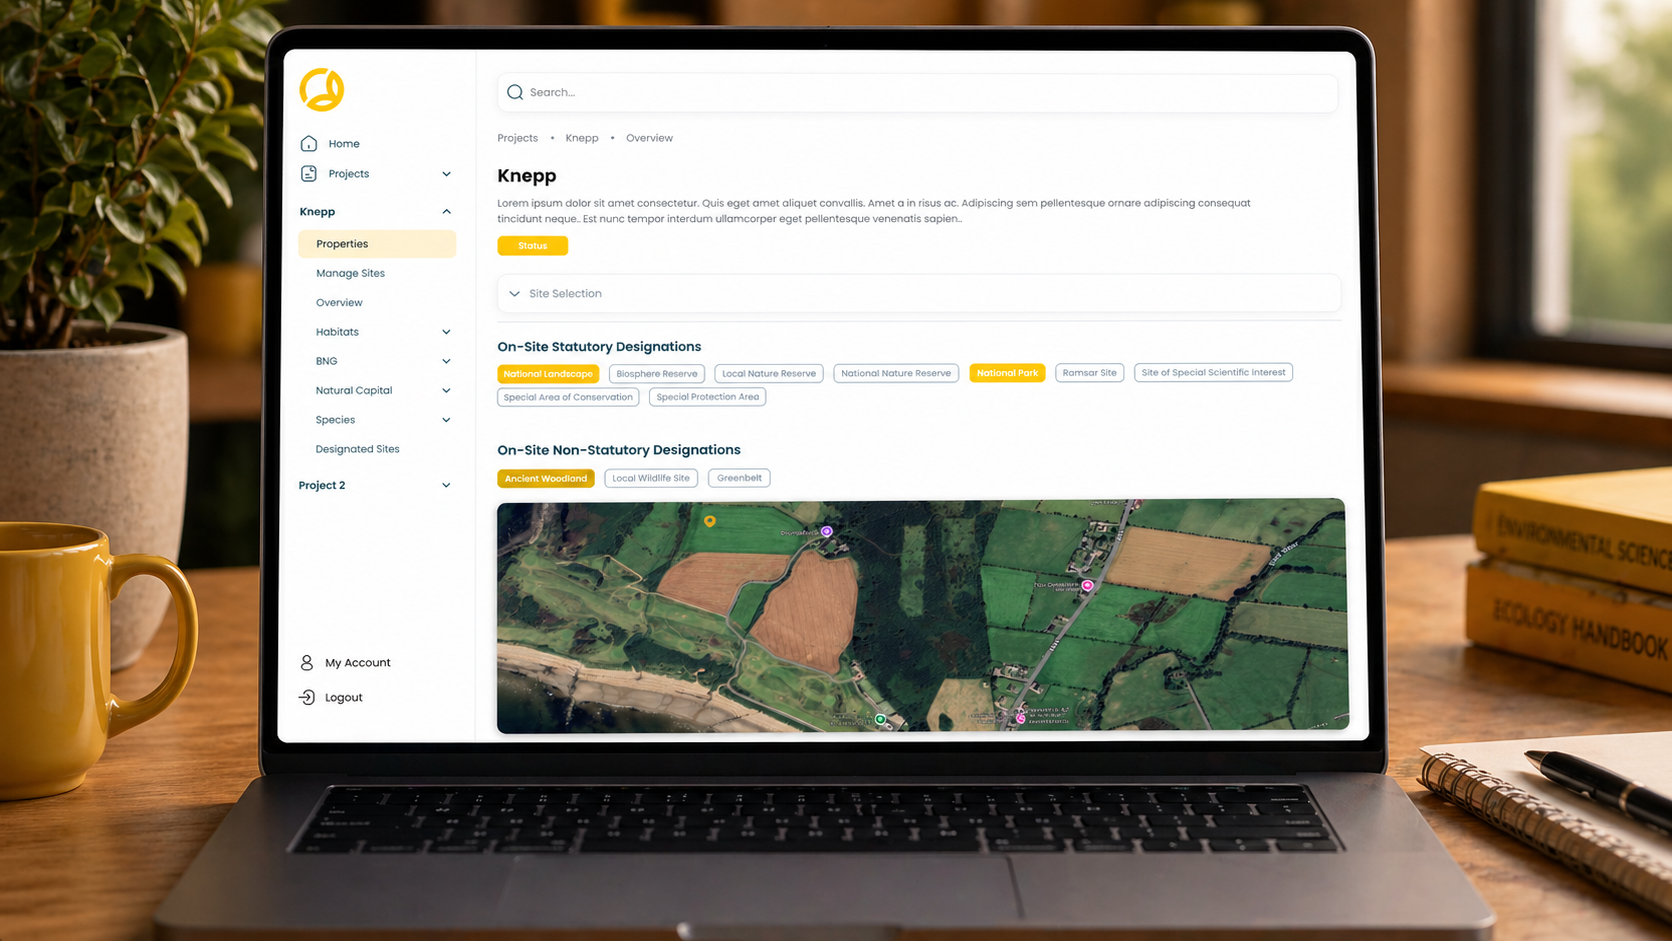
Ecosulis is one of the UK’s longstanding ecological restoration consultancies. We built the web dashboards their teams and clients use to read the data that comes off real restoration projects, plus a Flutter field-capture flow that gets the measurements out of the clipboard and into the platform on the same day. The hard part: field measurements that arrive messy and still have to read clean on a client dashboard the same day.
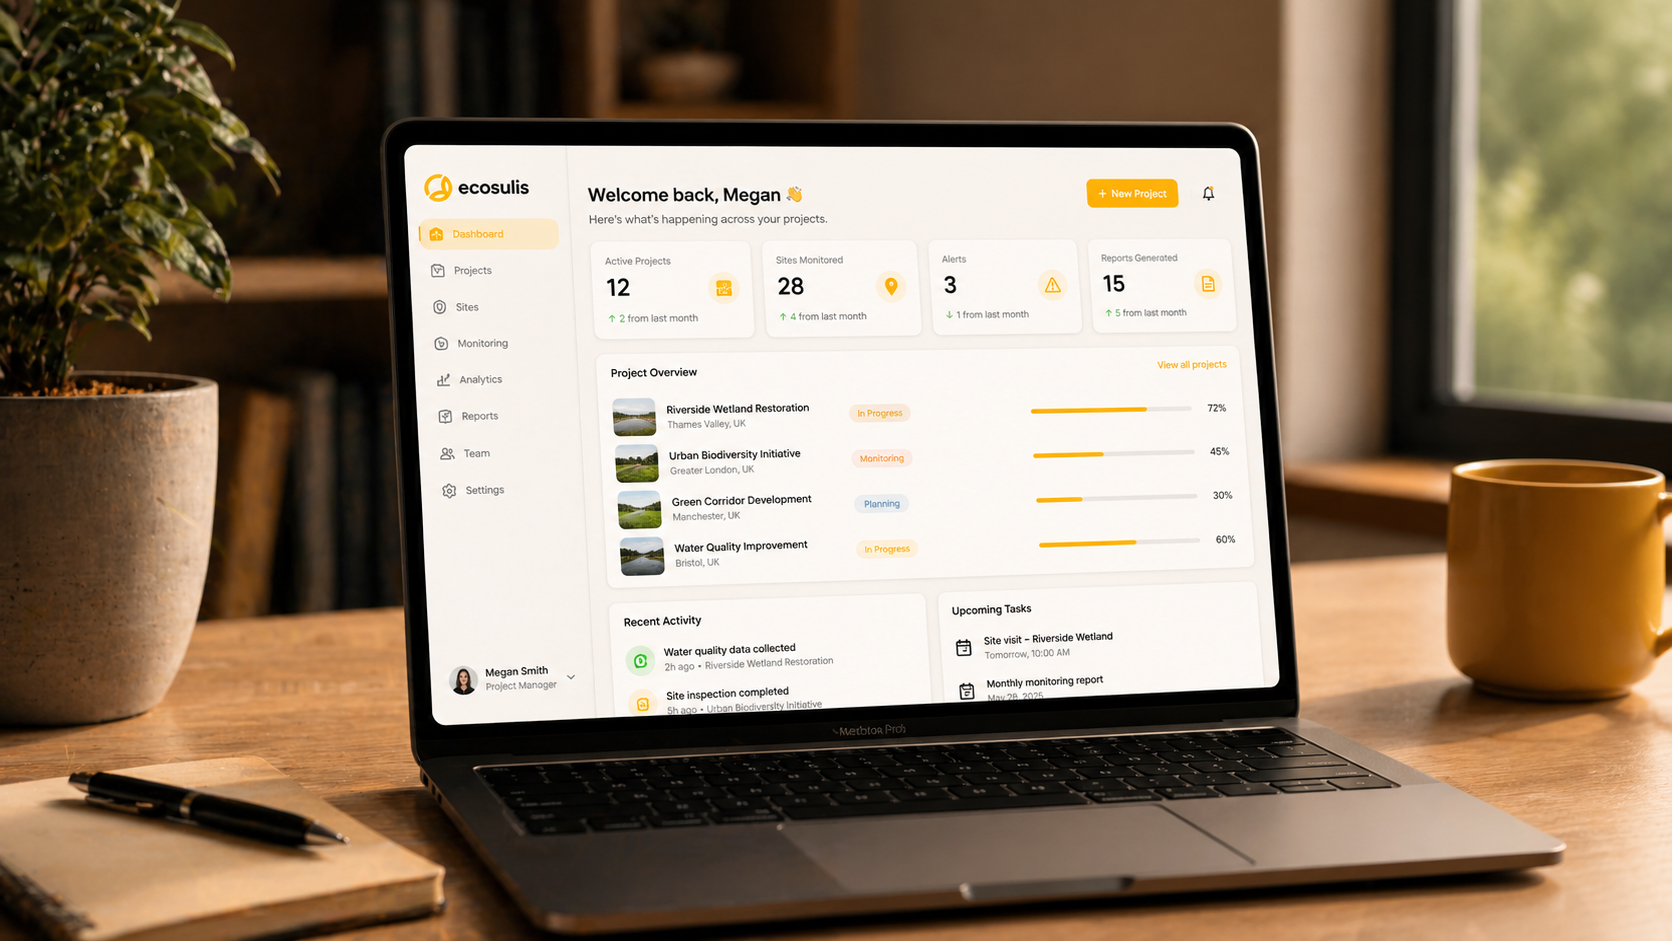 FIG. 04 · Featured Web dashboards · Field capture · 2025
 The brief
Restoration ecology is the long game. The data has to hold up across years, not weeks.
Ecosulis designs and runs nature-recovery projects across landscapes that need to be monitored properly to be worth anything. The brief was to build the web dashboards that turn ongoing site measurements into something the consultancy and its clients can actually read, compare across years, and report against.
Web is the primary surface. The Flutter capture flow exists to feed it — offline-first, structured at the point of entry, no clipboard-to-spreadsheet step in between.
What we did
Working out which restoration metrics deserve a dashboard and which are noise.
Dashboards built around how Ecosulis actually reports on a project, not how a generic data tool would.
A visual language honest enough to carry ecological data without dressing it up.
Web dashboards as the primary surface, with a Flutter capture flow for the field teams who feed them.
Outcomes
The dashboards are how Ecosulis tells the story of a site over time. The capture flow is how the story stays accurate. Together they replace the patchwork of spreadsheets and PDFs that restoration consultancies have lived with for years.
More from the project
Have something
worth building?
We take on roughly twelve engagements a year. Tell us what you’re building and we’ll reply within 24 hours.