Farm data,
finally legible.
AgriLogiq is the portal that turns the operational data farms already collect — yields, inputs, weather, equipment — into something an operator can read at a glance and act on the same day. We built it on a modern stack chosen for legibility, speed, and the long tail.
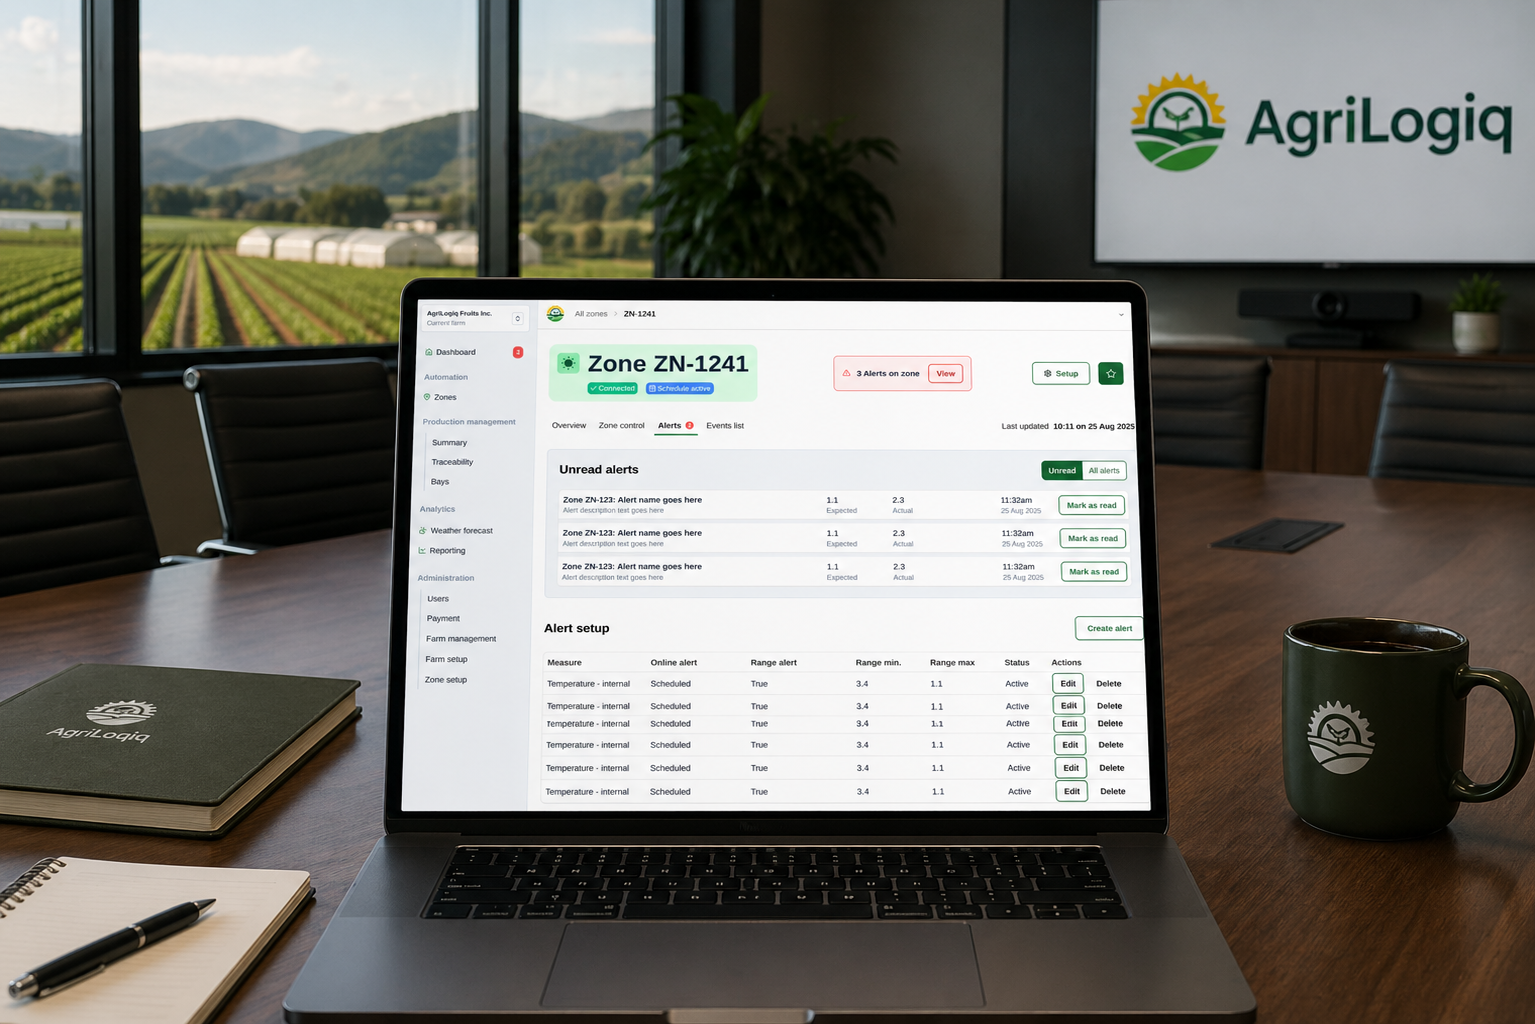 FIG. 08 · Featured Web portal · Analytics · 2026
 Agriculture generates data. Most of it goes into spreadsheets nobody opens.
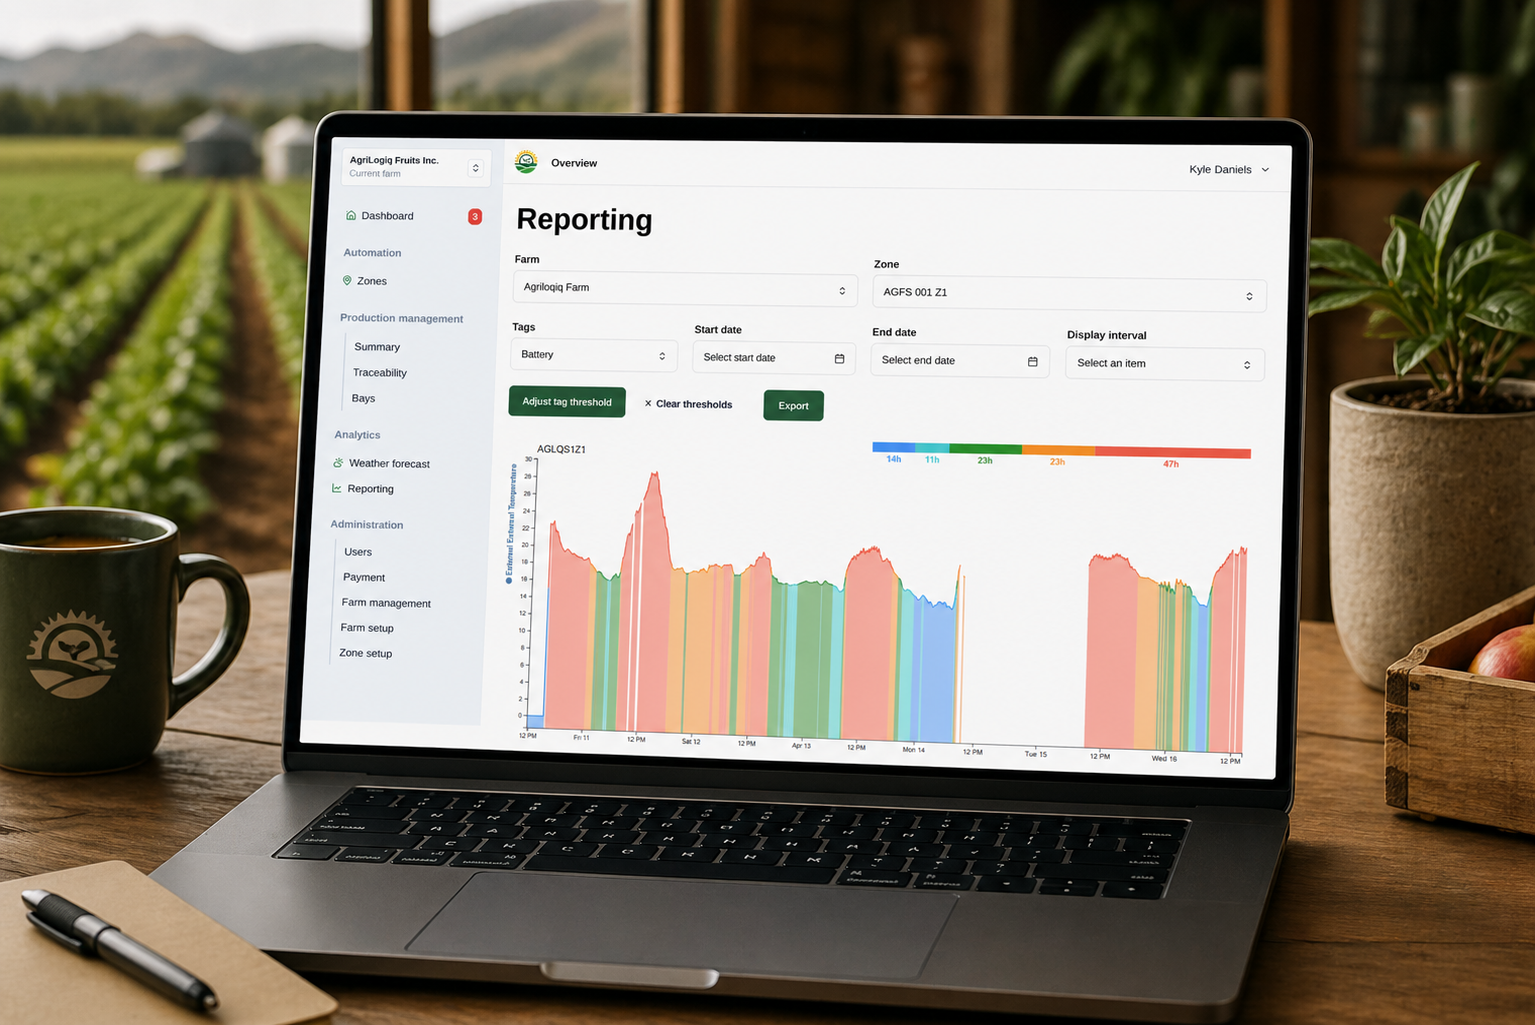
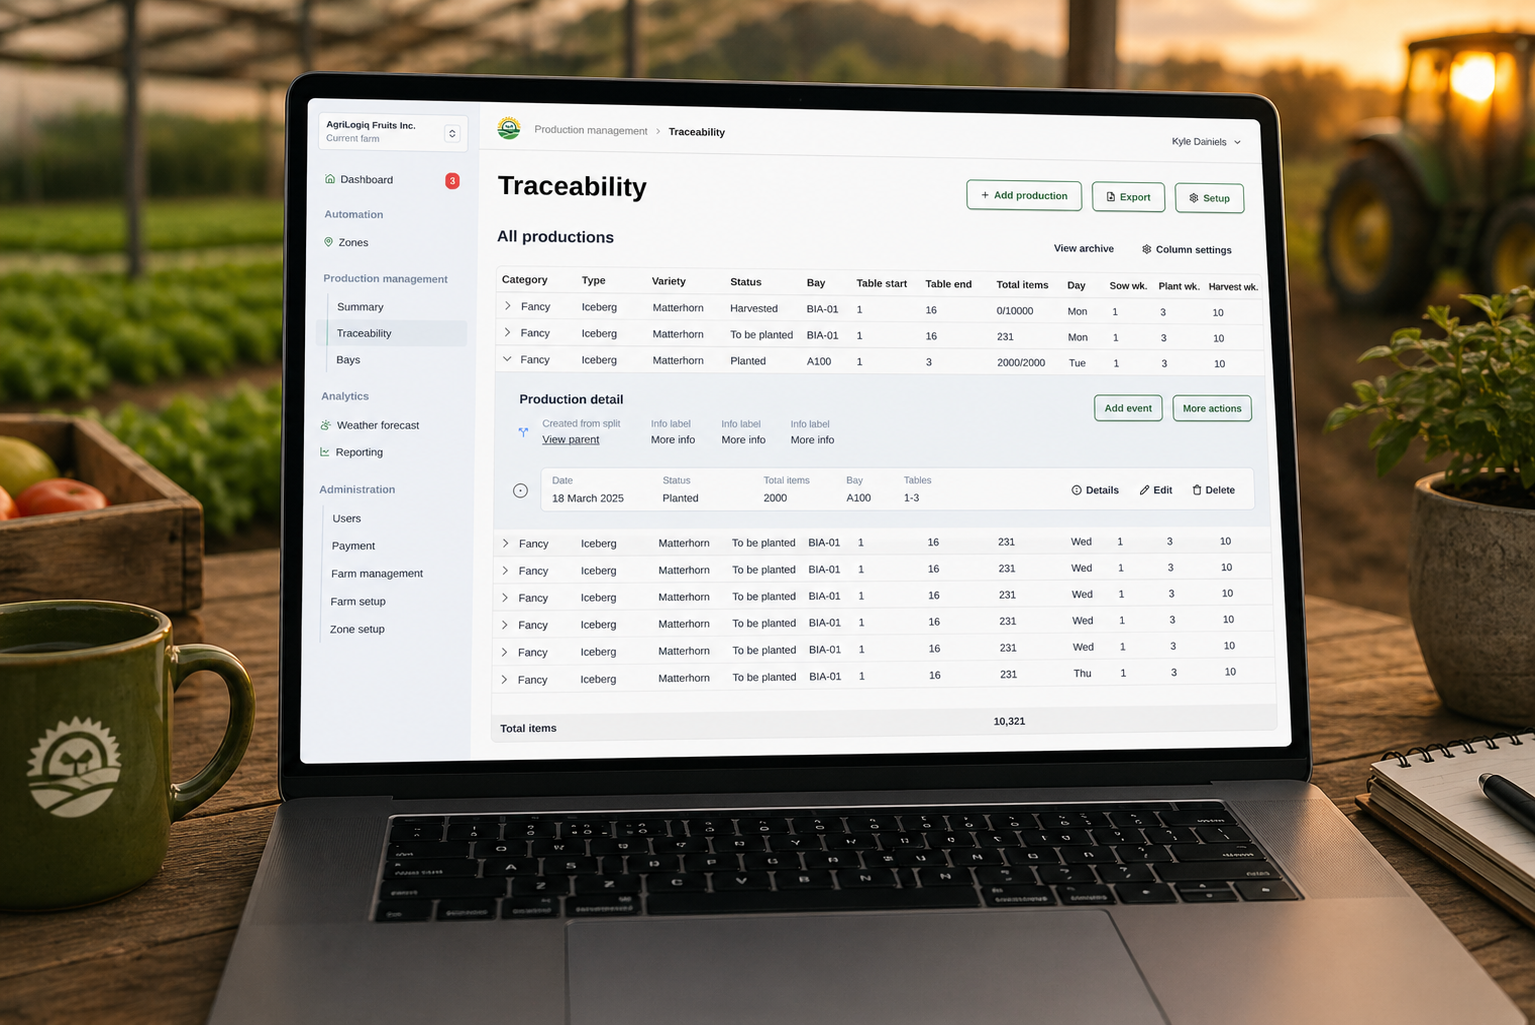
AgriLogiq wanted a portal that turns operational farm data — yields, inputs, weather, equipment use — into dashboards an operator can read at a glance and act on the same day. Less reporting, more deciding.
We picked a modern stack for the job: React, Vite, Radix, Tailwind, TanStack Query, Jotai. The kind of front end that renders fast, scales to a lot of records, and stays sharp on a tablet in a field.
Working out which farm signals actually drive a daily decision and which are background noise.
Dashboards an operator can read at a glance and act on the same day.
Information density that stays legible on a tablet in the middle of a field.
React, Vite, Radix, Tailwind, TanStack Query, Jotai. A modern stack picked for the kind of dashboards that have to render fast and stay sharp.
In production for working farms. Dashboards that make decisions easier instead of harder.
Have something
worth building?
We take on roughly eight engagements a year. Tell us what you’re building and we’ll reply within 24 hours.